White Papers & Articles
Related white papers and articles for AI Data & Analytics will appear here as they're published.
View MoreAI Data & Analytics
Dashboards and reporting, KPI monitoring, predictive analytics and operational intelligence, built on one agreed definition of every number - so the argument in the meeting is about what to do, not whose figure is correct.
Where it goes wrong
Ask two departments for last quarter’s revenue and you will often get two answers, each correct by its own definition - one counts bookings and the other recognised revenue, one leaves out refunds, one was refreshed on Monday. A new dashboard on top of that does not settle anything. It gives the argument a third number. The work that changes decisions happens before the chart: one definition for each measure, written down, owned by someone, and computed the same way everywhere it appears.
Every figure on a dashboard leads back to its definition, the tables it came from and when it was last refreshed. When someone asks where a number came from, the answer is on the page rather than in somebody’s head.
A screen built because the data was available rather than because a decision needed it. It looks finished on launch day and is quietly ignored by the end of the quarter.
Capability
Five areas. Most engagements begin with the pipeline and one decision, not with all five at once.
Reporting for the people who make the decision, built around the decision rather than around whatever happens to be in the warehouse. Real-time where the decision is real-time; a morning refresh where it is not, which is most of the time and costs a great deal less.
A small number of agreed measures, watched automatically, with an alert that reaches a named person when one moves outside the range that matters. An alert nobody owns is noise, and noise is how monitoring gets switched off.
Forecasts and recommended actions built on your own history, with the uncertainty shown rather than hidden. A forecast drawn as one confident line is the quickest way to lose a room the first time it misses.
The part that decides everything else: data taken out of the systems that hold it, cleaned, joined and modelled once, in a form every report reads from. This is where most of the effort goes, and it is where it should go.
Analytics wired into the work rather than sitting beside it - the exception flagged in the queue where it gets handled, not on a dashboard somebody has to remember to open.
How we work
Which decision is this for, who makes it, and how often? A number that does not change a decision is a number nobody needs to maintain.
For every measure that decision depends on: what it counts, what it leaves out, where it comes from and who owns it. Written down before anything is built, because this is the step every later argument comes back to.
Taken from the systems of record, modelled in one place, tested, and read by every report that uses it. If two screens show the same measure, they read the same table.
Three stages in, the number is agreed and computed once. The last two put it in front of the person who acts on it.
A dashboard, a scheduled report, an alert in the channel the team already uses, or a forecast inside the planning tool - whichever form is actually in front of someone at the moment the decision is being taken.
The models, the tests and the metric definitions live in your repository and your warehouse, written for whoever inherits them. When a definition has to change, your team changes it once and every report follows.
Straight answer
A dashboard does not make decisions, so any multiple on decision speed is a guess dressed up as a figure. What can be promised is narrower, and it can be checked: that the number on the screen is the one everybody agreed on, that anyone can see where it came from and when it was last refreshed, and that when it is wrong, it is wrong in one place and fixed in one place. Whether that makes your meetings faster is something you will be able to measure yourselves - and we would rather you did.
Before you ask
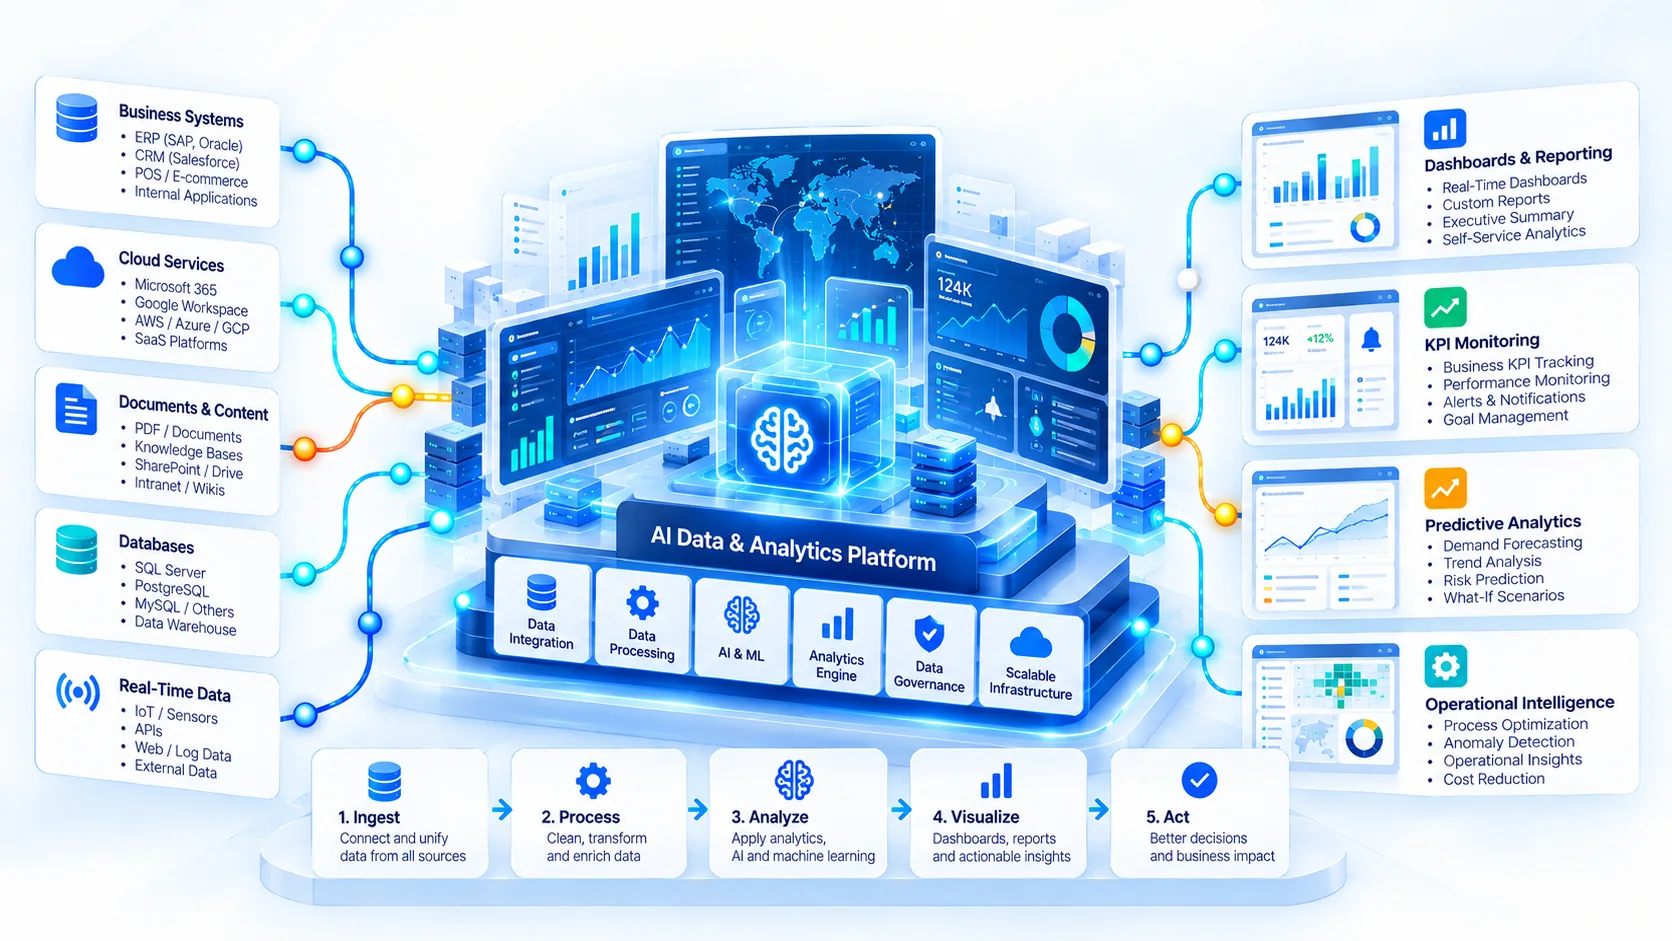
Power BI and Tableau for reporting, dbt for modelling, Snowflake, BigQuery and Databricks underneath, and custom AI dashboards where an off-the-shelf tool does not fit. Usually the right answer is the one you already license: a new BI tool rarely fixes a definition problem, and it always brings a migration. The systems drawn in the illustration at the top of the page are examples of where business data tends to live, not a list of integrations we have built or partnerships we hold.
No - waiting for clean data is how analytics projects stall. Start with one decision and the handful of measures it needs, make those right, and let the rest wait. Tidying the whole estate before anyone sees a number is the most reliable way to spend the budget without changing anything.
In two places, and it is worth being precise about both. Forecasting and anomaly detection are machine learning, and they are only as good as the pipeline underneath them. Asking questions of your data in plain language is newer: it works well on a well-defined model and badly on a messy one, which is one more reason the definitions come first.
As far as the history behind them, and no further. If the business changed shape recently, the past is a weaker guide, and the forecast should say so. Each one shows its range rather than a single line, and is checked against what actually happened, so you can see how much to rely on it before you do.
System Integration puts an assistant inside the tools your team already uses and lets it answer from the systems behind them. This is the step before a number can be trusted at all: the pipelines, one definition per measure, and the dashboards, alerts and forecasts built on top. The two meet often, because an assistant is only as good as the figures it repeats. System Integration.
Next
Send us two reports that should show the same number and do not. We will come back with why they differ, which definition should win, and what it would take for every report to agree - which is usually a smaller job than a new dashboard.
Related white papers and articles for AI Data & Analytics will appear here as they're published.
View MoreGet in touch and we'll help you find the right approach.
Talk to Us